
A day of Heavy Equipment NVH Testing activities
In past years, the heavy equipment market has been growing worldwide. Most importantly, in rapidly emerging economies, agriculture and construction machines play a crucial role in economic growth. However, like most industries, this one is also going through rapid changes that impact the development of those machines. What are the main concerns of those teams? Let’s discuss some of the heavy equipment NVH testing challenges in this blog.
Environment impact, globalization and…very demanding customers
The worldwide push towards green sustainable economies is favorably impacting heavy equipment development. For instance, many governments are putting noise and emission regulations in place. The manufacturers need to consider it at the start of their development process to avoid last-minute troubleshooting actions to comply with these regulations.
But this is insufficient. Globalization and increasing customer demand push manufacturers to develop better machines. They do not only comply with regulations but further differentiate concerning customer comfort.
Today I want to talk about the noise, vibration, and harshness (NVH) testing activities that are important in these machines’ development cycle. I invite you for a tour of a recent NVH testing activity I dove into. The goal was to experience these testing challenges and their importance in the final machine project.
Note: The wheel-loader and the test area were courtesy of VDAB Opleidingscentrum (Belgium).
The machine is there…what should I test?
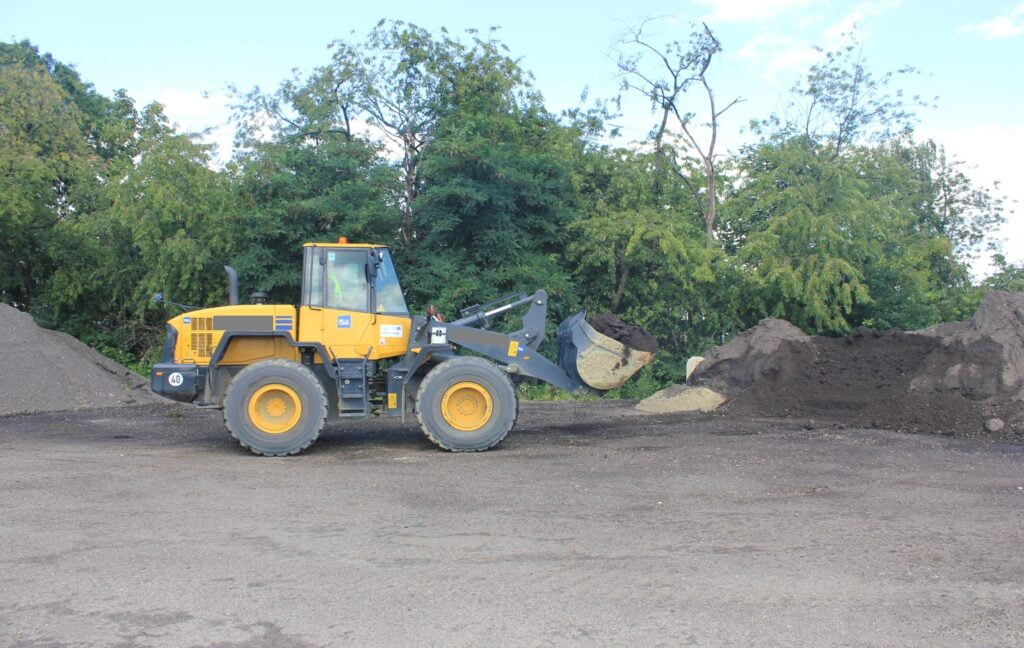
Last summer, I went with my colleague to a test field to acquire some wheel-loader data. We wanted to understand the NVH behavior and how it impacted the operator inside the cabin.
A full NVH testing schedule of such a machine would take several days to be completed. We selected a simplified program where we could acquire and process data for the following applications:
- Human body vibration
- Operational NVH analysis
- Cabin sound quality analysis
- Sound source localization using an array of microphones
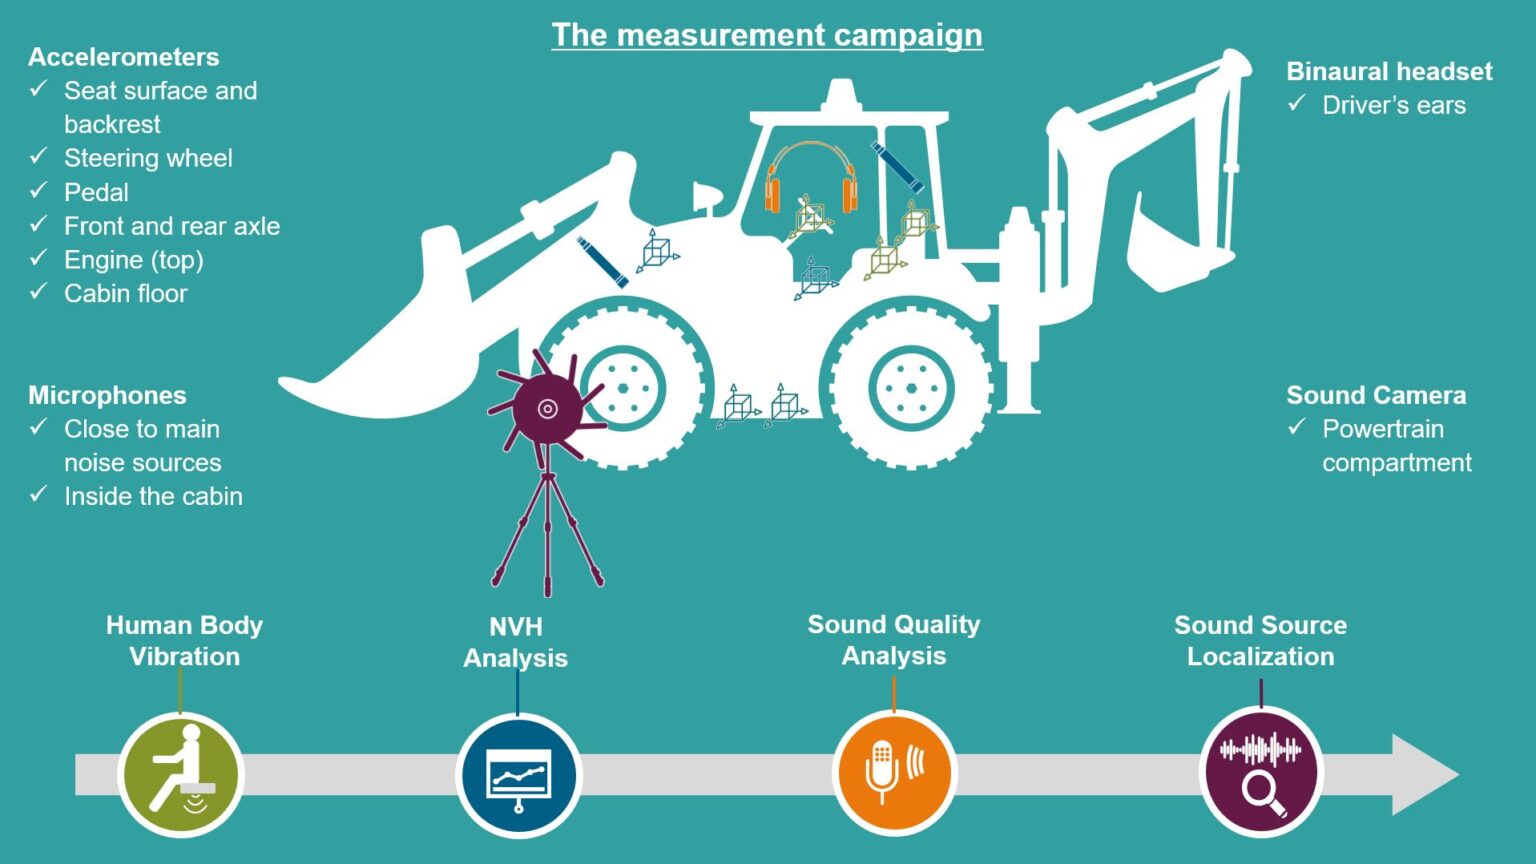
As illustrated in the info-graphic above, we’ve used accelerometers, microphones, a binaural headset, and an array of microphones. The idea was to identify the primary NVH sources around the powertrain and there inside the cabin.
Note: Measurements to check the machine reliability (durability / structural testing) will not be included in this blogpost.
Human body vibration
We selected this topic as it’s an important aspect for the operator’s comfort during the machine operation. Long duration exposure to high vibrations on hand at the steering wheel or whole body through the seat or floor can, in at worst case, cause health issues for the operator. This is one of the reasons international standards and local regulations are in place. Performing those measurements is not only a must to check if compliant. They are also interesting just as a measure of the vibration comfort of the machine.
To access these levels, we have followed the instructions in the ISO standards below:
- ISO 2631: Whole-body vibration
- ISO 5349: Hand-arm vibration
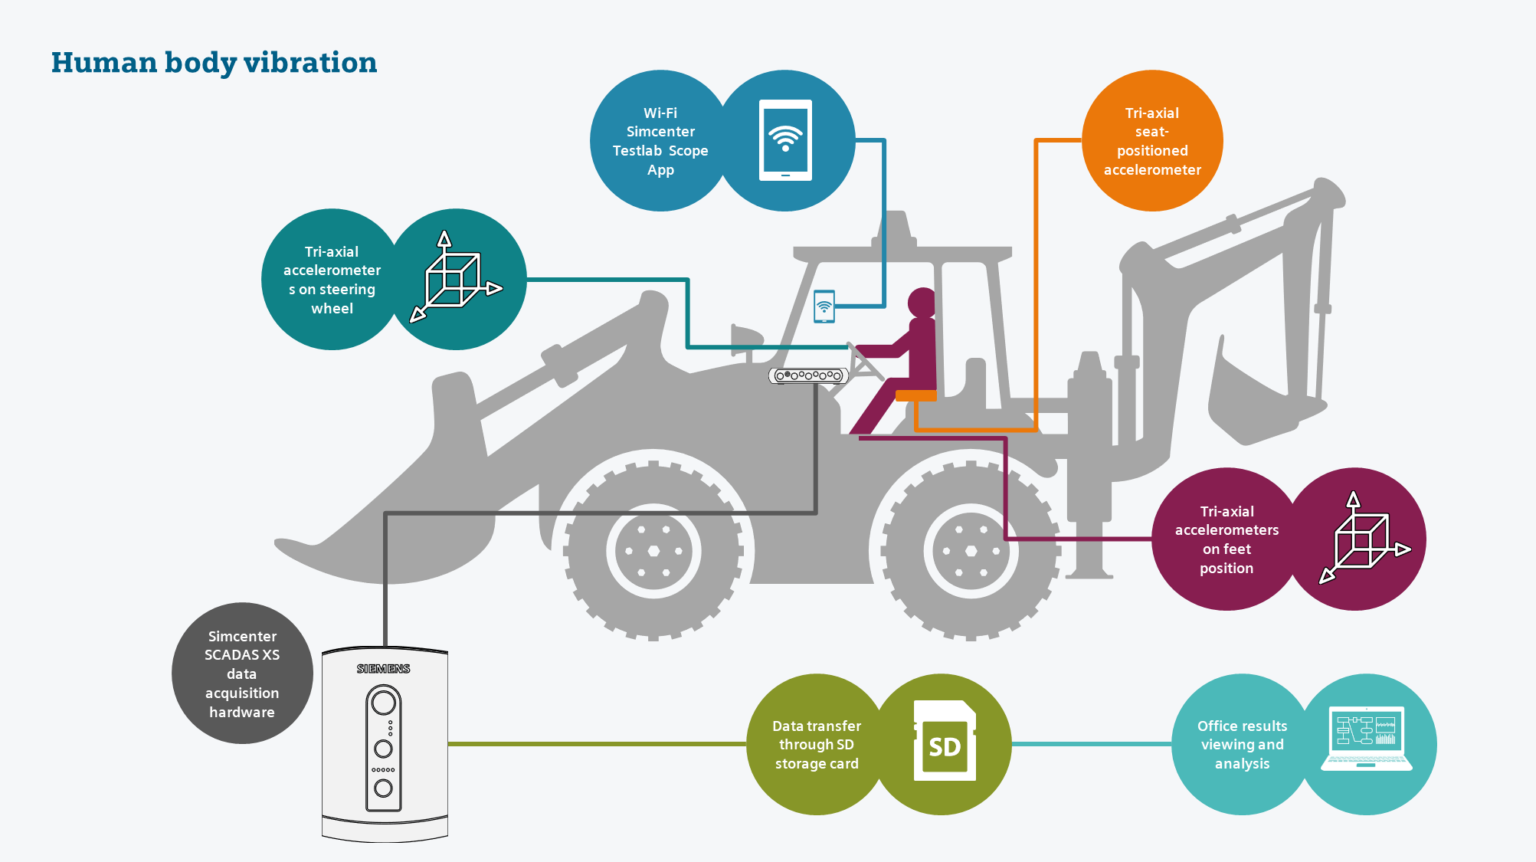
Besides vibration, two other elements play a key role in quantifying how discomforting those are for human operation. First of all, the frequency; certain frequencies are more damaging as those lie in the frequency range of the human body’s natural frequencies. Secondly, the direction of the vibration plays a key role too.
How to measure these vibrations?
The measurement consisted of tri-axial accelerometers, each connected to the Simcenter SCADAS XS. Data processing with the Simcenter Testlab software further filters the data with different human-body vibration weighting filters. The next step is the calculation of RMS levels and, in the end, combination the 3 directions into single vibration values. The standard describes different calculation methods to access the final vibration levels.
Not to our surprise, all vibration levels were below the limits. We could confirm that this machine conformed with human body vibration regulations.
We were expecting vibration levels below the limits as this is a released machine. However, the comfort level of the machine can also be verified throughout Human body vibration analysis. Therefore, those measurements are also of interest for machine manufacturers to perform benchmarking or target settings. In a world with increasing competition and increasing customer comfort expectations, taking human body vibration comfort into account early in development becomes a must.
Another important assessment is the interior and exterior sound power levels (not included in this test activity). These tests follow ISO standards (ISO 6393 / 6394 / 6395 / 6396). Depending on the type of machine, different standards apply. The Key is that each of those measurements is fully supported as well within the Simcenter solution. Even efficient one-person operated tests that combine both interior and exterior sound power measurements are supported.
Operational NVH analysis
In most cases, meeting regulations or even more ambitious NVH targets requires more in-depth engineering and design iterations. The first aspect is the assessment of more operational NVH data with different sensors spread over the machine. This allows more detailed troubleshooting.
So, this is exactly what we did. We decided to instrument accelerometers and microphones close to the main NVH sources in the powertrain compartment (source side). On the other side, we also instrument it inside the cabin (receiver side). The operator-controlled accelerations from idle to maximum engine speed and data were measured in ascending (run-up) and descending (cost-down) speed.
Excitations from sources such as the engine and transmission can lead to acoustic or vibration discomfort. To investigate those, both the sources and the insulation of the cabin are of extreme importance. This pragmatic approach allows us to analyze and compare those signals together.
In our test, we decided to check the main noise and vibration sources in the machine operating conditions and check if they affected the cabin comfort.
Is the cabin insulated enough?
We found that the cabin insulation was very well for vibrations coming from the powertrain. However, the noise was not being isolated equally well for all-important engine operating conditions.
In this example, the instrumentation was quite simple and straightforward; we used classical ICP microphones and accelerometers. In many cases, it can be important to add quite a lot of different sensors. Imagine, for instance, if you need to measure hydraulic pressures to correlate them with NVH; displacements of components using, for example, string pots, the rotational speed of actuators or the powertrain, vehicle speed, and location using GPS to link NVH events to the site of the machine, machine state conditions available on the CAN-BUS to be connected to NVH, etc. These are all prevalent things to troubleshoot for different NVH aspects effectively. All the above scenarios are supported with the Simcenter SCADAS hardware. Any multi-physics signals data acquisition can be addressed with the same hardware family covering many measurements and data streams, all within one synchronized data set.
Although the cabin’s level was indeed at an acceptable level, there was room for further improvements. Should we completely dismiss that or further investigate it? I don’t need to say that we went for the second option and decide to extend our analysis.
Sound quality analysis
To investigate the impact of engine noise on cabin Sound Quality, we used data recorded with our Simcenter Binaural Headset. This sensor allows recording the data completely as perceived by the operator, as it measures the noise at both left and right ear driver’s position. Being able to assess exactly how the sound is perceived allows one to focus specifically on the sound’s quality; recorded data can be fully replayed identically to how it sounded in the cabin. Since the machine’s perceived quality, including sound quality, becomes an increasing decision criterion for the end-users, more and more of these measurements become crucial.
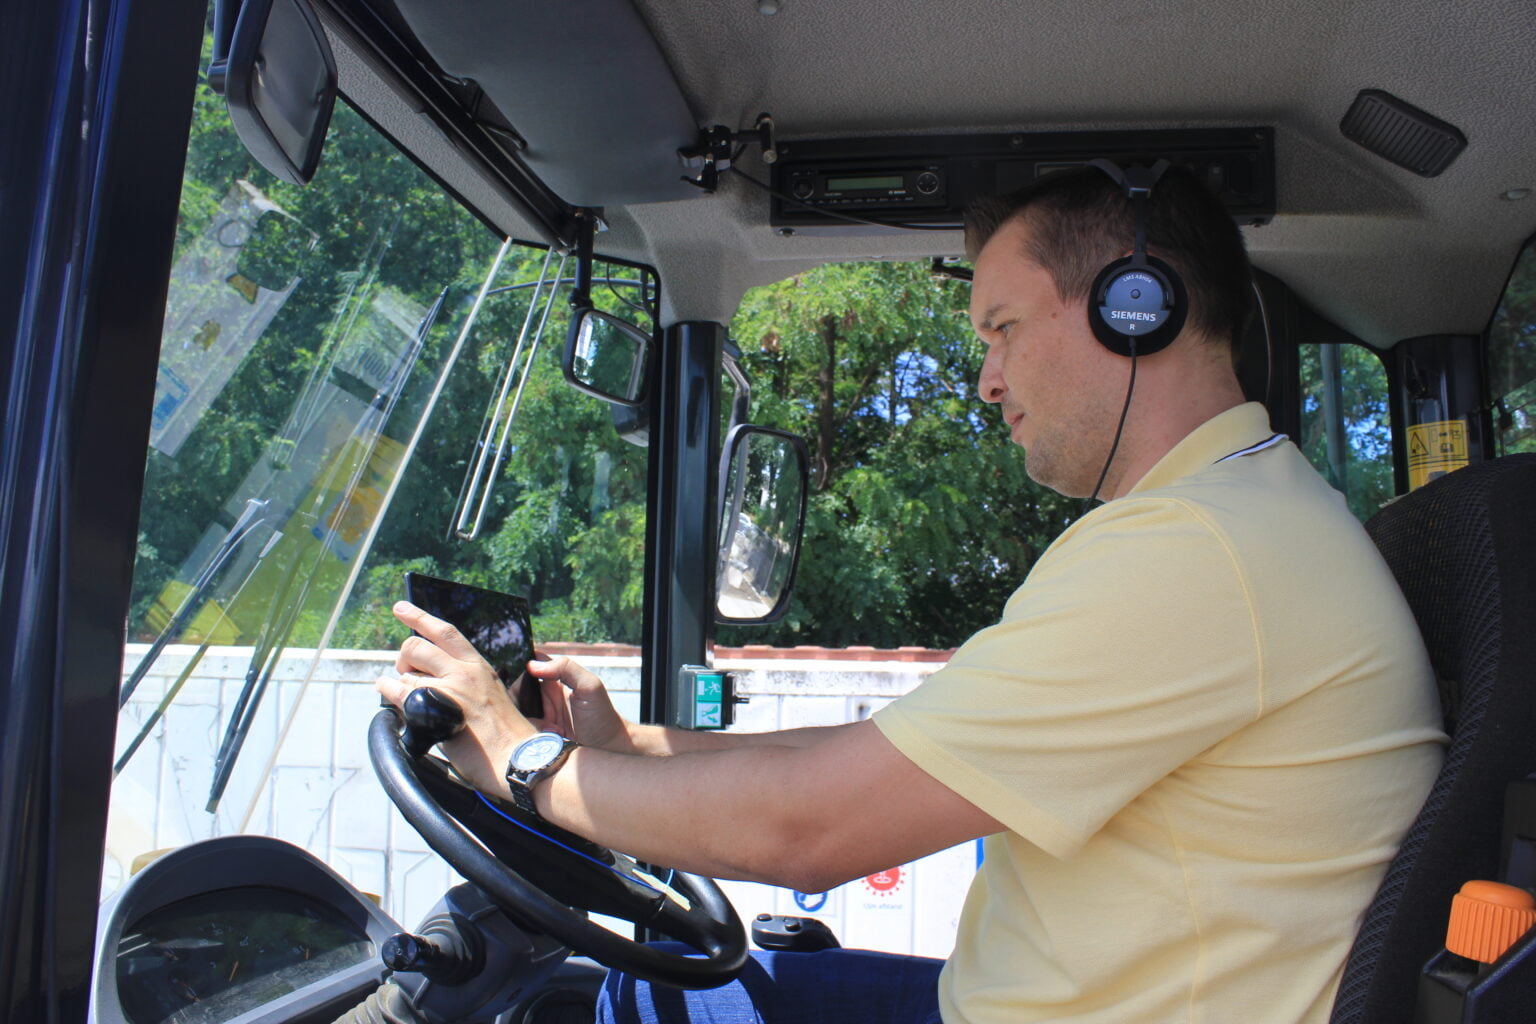
The sound quality analysis allows us to understand better the sound and how the end-user will perceive that. It involves usage of the so-called psychoacoustics metrics in combination with audio replay & filtering capabilities.
When performing the quality analysis, I used filters during binaural replay. We try many different filters, but we definitely agreed that the engine firing orders (especially order 12) had a large effect on the total sound quality perception. Reducing or even completely removing this order while doing the replay highly increased the quality. The ability to execute these “what-if” analyses using filtering capabilities is another positive point of conducting sound quality analysis during these machines’ development process.
What could be done to improve the Sound Quality?
Although we all agreed that reducing the engine fire order inside the cabin would be a significant quality improvement, the next question is how this could be achieved. For that more in-depth analysis, it all goes back to what is called the source-transfer-receive principle. Some examples of what could be done next are:
- Focus further on the powertrain itself, the source, for instance, using the sound source localization techniques.
- Investigate the airborne/structural transfer paths from the powertrain to the cabin.
- For lower frequencies, such as the engine firing orders, this may require looking at the machine’s structural properties and mode shapes using experimental modal analysis. For mid to high-frequency noise, which is usually more airborne radiated, it may be required to understand if there are leaks in the cabin, such as sound source localization techniques.
- To capture the complete picture of how the entire process, from engine excitation all the way to interior noise, Simcenter Testlab Transfer Path Analysis is the path forward, which maps the complete process from the source towards the receiver.
To illustrate some of the above, we had a closer look at the powertrain compartment side (source location). As different noise sources like engine, intake, exhaust, and fan are located very close to each other; we wanted to use sound source localization techniques to understand better the noise scenario.
Sound Source Localization
Sound source localization techniques are available in the market for a long time and represent a powerful way of assessing noise problems.
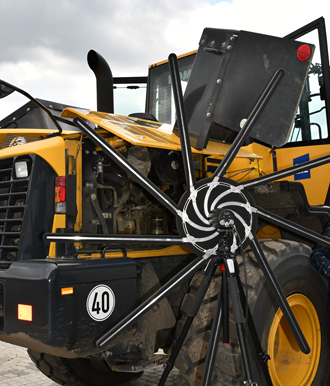
We used Simcenter Sound Camera, a digital microphone array consisting of lots of microphones (as low-frequency noise was the target, we used the configuration with long arms with a total of 117 microphones). As the array has digital microphones, we didn’t have to use any Simcenter SCADAS frontend. We positioned it pointed to the powertrain compartment to capture the sound during a ramp-up in static condition.
On top of the default beamforming, Simcenter Testlab counts with additional processing methods. As beamforming does not supply accurate results in low frequencies and faces lots of low frequent powertrain noise, other processing is crucial. We choose Bayesian focusing technique that presents good results in low and high frequencies.
What can these friendly holograms tell me?
The results (one localization hologram per 1/3 octave band) show exactly which component is most noisy for each octave band. As expected, in the frequency range we have used to investigate the noise inside the cabin, the engine is responsible for most of the sound (around 500 Hz).
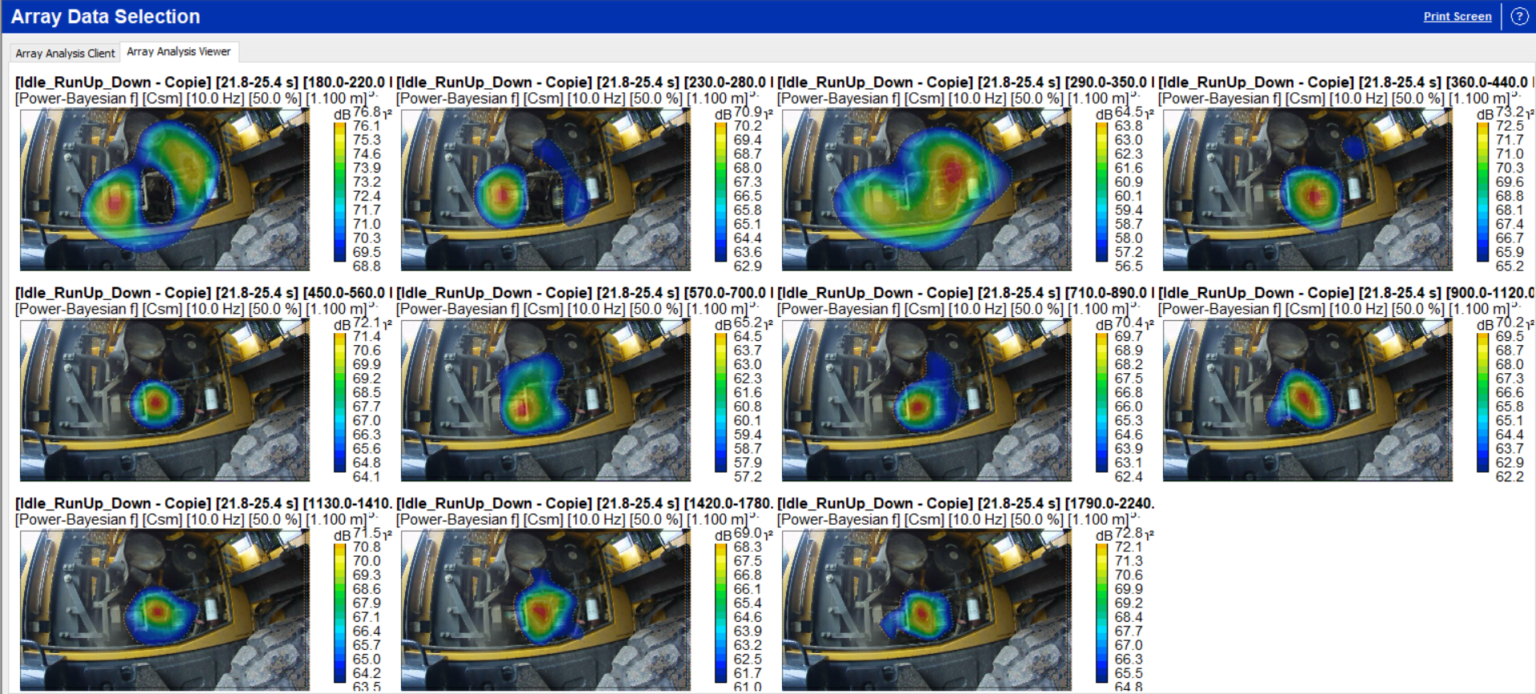
There are two ways to move forward and try to change the engine, which is very unlikely to do. More logically would be to assess further if the transfer to the cabin cannot be further optimized. For instance, the next step would be to go with Sound Camera inside the house to identify where the sound leaks into the cabin. Another great option is adding a near-field microphone close to the engine and combining it with the Sound Camera into one measurement. In Simcenter Testlab, the user can analyze the sound map within the cabin, coherent with this microphone close to the engine; identify where the engine noise leaks into the vehicle. But this will be for another measurement campaign.
The end of an enjoyable Heavy Equipment NVH testing day
That was the end of our testing activities with that wheel loader. It was impressive the amount of analysis we could do with a simplified setup and how we could link the different applications. We could prove the importance of using multi-physics testing systems to execute separate analyses in a single test data stream. This brings efficiency to the development process and makes sure that end-users will have a pleasant experience while operating their machines. We did a lot in one day, but at the same time, many other activities could follow with the same tools. These activities have all one common goal: further, optimize or improve the NVH comfort.
Are you interest in deep dive into these and other Heavy Equipment Testing activities? If yes, I invite you to watch our upcoming live webinar, “Maximize cabin comfort of heavy equipment with Vibro-acoustics simulation and testing.”

Don’t hesitate to contact Thanh for advice on automation solutions for CAD / CAM / CAE / PLM / ERP / IT systems exclusively for SMEs.
Luu Phan Thanh (Tyler) Solutions Consultant at PLM Ecosystem Mobile +84 976 099 099
Web www.plmes.io Email tyler.luu@plmes.io
