Industrial Challenge: Materials Engineering for Composites subject to Variability
The powerful combination of being strong and lightweight makes composites materials favorable for the automotive and aerospace industry. This low weight translates into a reduction in fuel consumption and emission. Composite materials are more complex than metals, with more design parameters. A robust design is desired, which guarantees the product performance, considering variability in materials deriving from manufacturing processes.
For predicting the performance of composite materials (e.g., in terms of strength and fatigue life), a multi-scale modeling approach can be used to include details from lower length scales, such as the random fiber arrangement and the presence of voids. This is possible, for instance, with the multi-attribute solutions for composite materials offered in Simcenter 3D, including multiscale simulation powered by Simcenter Multimech. Additionally, for short-fiber composites, Siemens Digital Industries Software (DI SW) has solutions to calculate the product performance in terms of strength and durability, based on the material properties that result from the injection molding process simulation. By adopting a detailed multi-scale CAE approach for materials engineering, one can accurately predict the composite properties and optimize the final product performance.
Nevertheless, product performance is affected by material variability. For this reason, variability must be considered with statistical models rather than with a deterministic description. This has also been shown in a previous blogpost [3], where Monte Carlo simulations were used to evaluate strength variability of unidirectional carbon fiber materials. When evaluating the impact of variability, a calculation method must be carefully selected to limit the calculation time of deterministic models while producing the desired results accuracy. This blog post will look into this balance of accuracy vs. performance for a composites engineering application subject to variability.
Conventional Solution: Variability Assessment with Monte Carlo Simulation
The Monte Carlo Simulation method
A deterministic case is an engineering model without variability present so that it has a single set of input parameters and model parameters. For instance, a Finite Element (FE) model, for which a single deterministic Finite Element analysis then leads to a single prediction of the structural performance (displacements, stresses, strains, …).
When variability is present in the model definition, a probabilistic approach must be adopted to evaluate the impact of variability in input/model parameters on the structural performance. The structural performance then also becomes variable – a variability distribution of the product performance. The most straightforward method for variability assessment is called Monte Carlo simulation [1]. Named after the famous casinos in Monte Carlo, where random events are generated, e.g., on the roulette table, the method generates random samples in line with the input variability distribution. This gives insight into the mean product performance (the most likely performance) and the performance distribution (the spread / the variability on the performance side). The Monte Carlo simulation can be put on top of every deterministic case – it merely generates random samples for that case, given the input variability.
Application of Monte Carlo Simulation to Composites
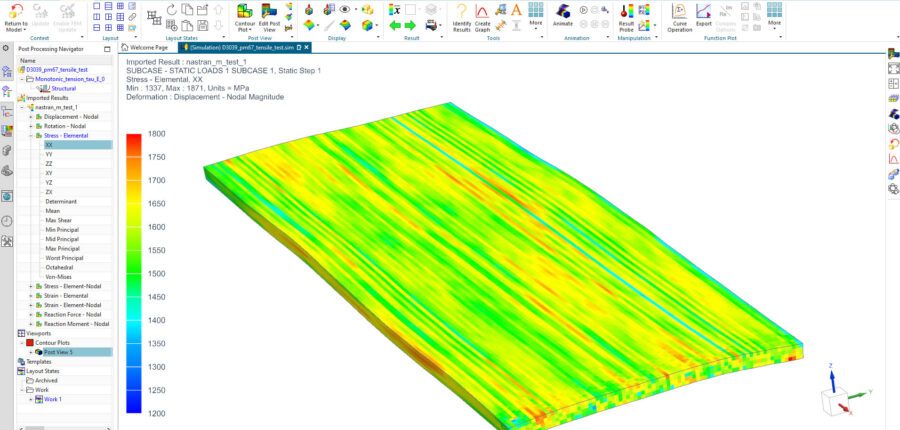
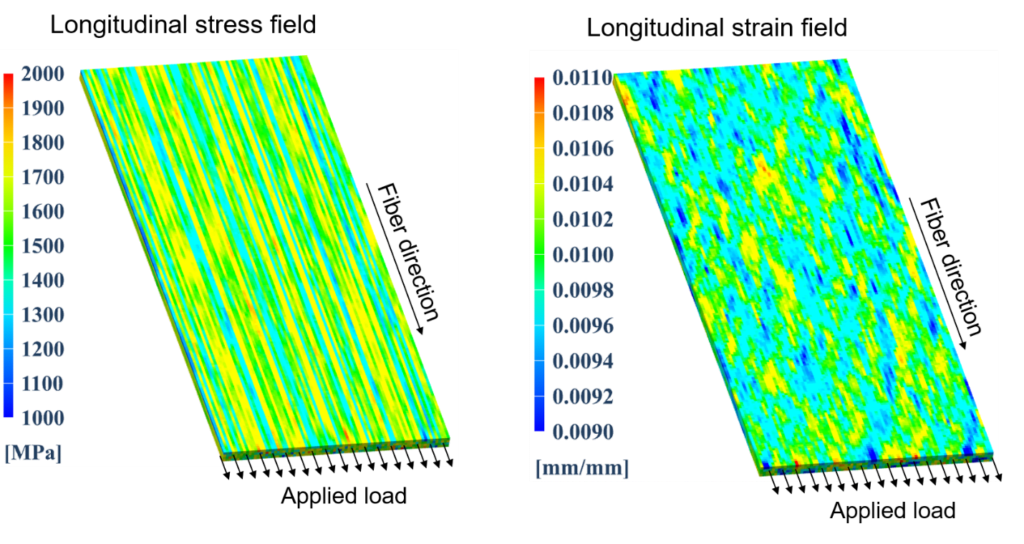
In a previous blog-post [3], it has been shown that variability analysis of composites has become a reality through the combination of multi-scale approach for the composite simulation and subsequent Monte Carlo simulation for the variability assessment. For a unidirectional (UD) carbon fiber reinforced composite plate subject to loading, with variability present in the local fiber volume fraction and fiber misalignment, one sample’s stress and strain field are shown in Figure 1. Clearly, the stress level is not uniform at the microscale: each location has a different stress value.
For this case, Monte Carlo simulations have been run automatically for many virtual composite coupons. In this way, distributions of mechanical properties can be obtained virtually on many samples, which would be impossible in real testing. The local strength can be calculated either with a full Finite Element (FE) calculation [4] or with an analytical calculation [5].
The Monte Carlo simulation approach is reliable, has broad applicability, and delivers good insight into product performance variability. However, the Monte Carlo simulation approach has a significant downside: it requires a high computation time, proportional to the number of deterministic simulations required (ranging from tens to hundreds).
New Approach: Virtual Testing based on Regression Model
A new fast method based on regression analysis
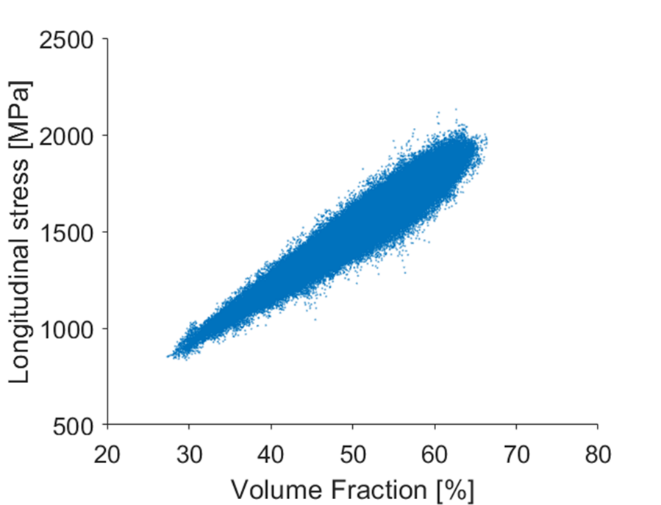
By observing Figure 1, it can be noticed that the local material response is not homogeneous at the microscale. This is because local material properties based on different fiber volume fractions and local fiber misalignment are accounted for in the model. It is possible to map the local material response in terms of longitudinal stress as a fiber content function (Figure 2). The result is a cloud of points that well represents the variability of the material. In other words, this cloud represents a ‘material fingerprint,’ which gives a visual insight into the material variability.
As an alternative to the Monte Carlo simulation approach, a new approach based on a regression model [7] will be adopted in this blogpost to reduce the computational time dramatically.
The material response is obtained on a limited number of virtual specimens using full FE model calculations as a first step. Then, a regression strategy is used to statistically characterize the material response (the one that can be observed in Figure 1), in fact learning from the material variability fingerprint generated with the FE models. This information can be used later to efficiently generate a material response of other virtual coupons without performing new FE simulations. This new regression analysis method, inspired by machine learning, can accurately replicate the material response obtained with a Monte Carlo simulation, but it is much faster.
Results for composites case
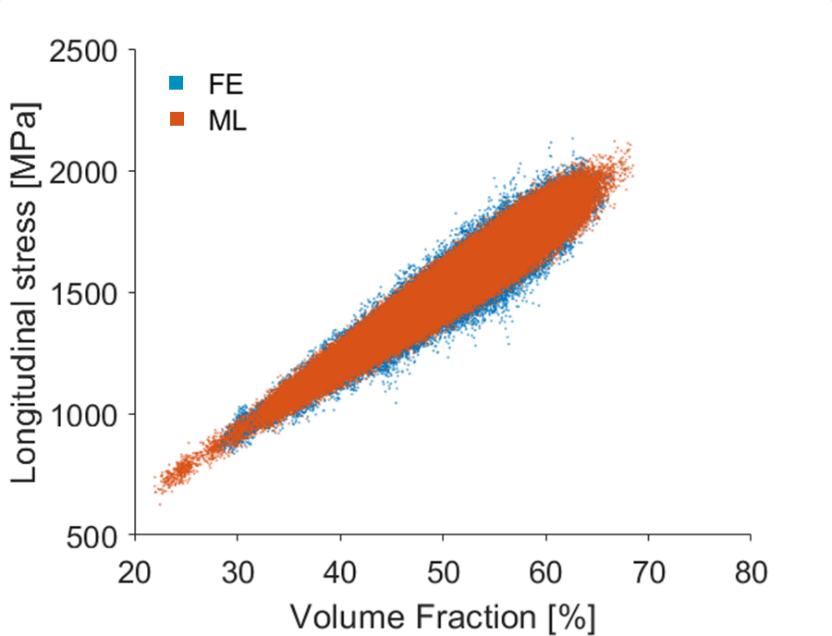
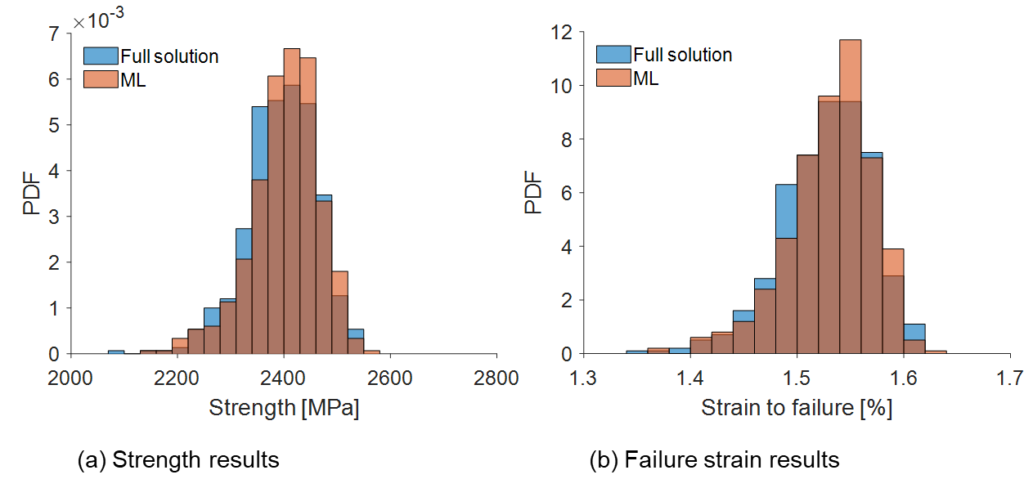
For the composites plate case presented above (see Figure 1), a few FE simulations (e.g., around 10) are sufficient to feed the regression model (note that each virtual test provides a large number of data points). Results of the regression analysis are shown in the subsequent figures. Figure 3 shows a comparison of the material stress characteristic – the point cloud of longitudinal stress as a function of the volume fraction, calculated with the full FE Monte Carlo approach and the fast regression analysis approach. It can be seen that both point clouds overlap, which confirms the accuracy of the new approach based on regression analysis. Figure 4 shows that the predictions of stress (left) and strain (right) obtained with the new fast regression analysis method overlap very well with the results obtained with the Monte Carlo approach based on full FE calculations. Clearly, a statistically equivalent material response has been generated.
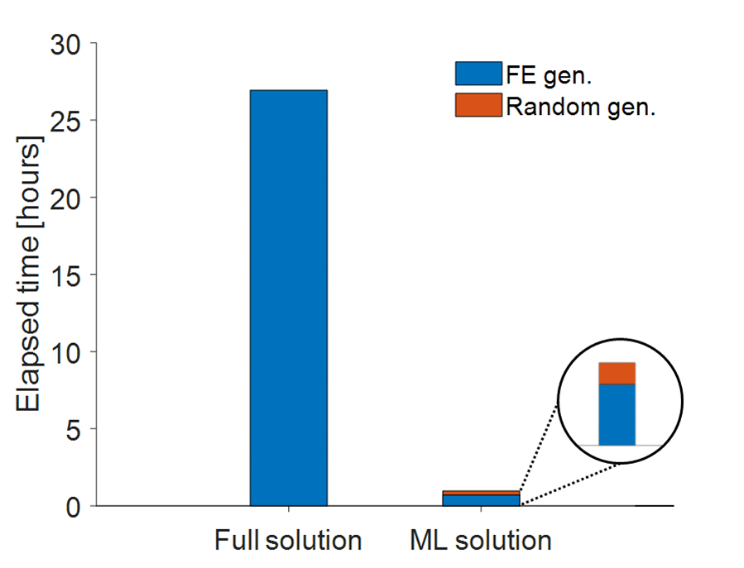
While the new regression analysis method achieves similar accuracy, the calculation time is much lower: where the Monte Carlo approach (based on full FE analyses) requires about 26 hours, the fast new regression analysis method requires less than an hour, as shown in Figure 5. The new regression analysis method reduces the calculation time from over a day to about an hour while maintaining accuracy. It can be seen in Figure 5 that about 75% of the calculation time is spent to train the regression model, whereas about 25% is then required for the variability assessment.
Conclusions
A fast new approach for variability analysis is presented, based on regression analysis. This requires an initial investment to train the regression model, subsequently allowing swift variability assessment. It has been shown that the accuracy is maintained while drastically reducing the overall calculation time as compared to the conventional Monte Carlo simulation approach based on full FE analyses. The fast new regression analysis approach allows mimicking the material performance variability from a statistical point of view. The design engineer can be confident to reproduce the correct material behavior quickly.
Both mentioned methods are a plus in the engineering design practice because variability in material properties and input parameters can be taken into account, and one can evaluate the impact of this variability on the product performance. This blog post has shown that one can switch from the deterministic case (1 full FE analysis) to a statistical approach (where Monte Carlo is rather expensive, and regression analysis is much faster) for a realistic virtual material testing scenario. Both methods have the benefit that they provide insight into the variability of the material performance.
Acknowledgments
The European Commission is kindly acknowledged for funding the “FiBreMoD” project, which is part of the Horizon 2020 research and innovation program under the Marie Sklodowska-Curie grant agreement No. 722626 (see http://www.fibremodproject.eu). In this project, Dr. Fabio Malgioglio has completed his industrial Ph.D. trajectory [7] at Siemens Digital Industries Software, under the academic supervision of Prof. Stepan Lomov (KU Leuven MTM), Prof. Yentl Swolfs (KU Leuven MTM), and Prof. Wim Desmet (KU Leuven LMSD) and industrial supervision of Dr. Laszlo Farkas (Siemens Digital Industries Software).
Siemens Digital Industries Software – Solution Offering
- Siemens Digital Industries Software, “Simcenter 3D”, Retrieved 2021.
- Siemens Digital Industries Software, “Simcenter 3D Materials Engineering”, Retrieved 2021.
- Siemens Digital Industries Software, “Simcenter Multimech,” Retrieved 2021.
References
- W. Dunn, J.K. Shultis, “Exploring Monte Carlo Methods,” Elsevier, 1st Edition, May 2011.
- L. Farkas, K. Vanclooster, H. Erdelyi, R.D.B. Sevenois, S.V. Lomov, T. Naito, Y. Urushiyama, W. Van Paepegem, “Virtual Material Characterization process for composite materials: an industrial solution,” Proceedings of ECCM17, Munich, Germany, June 26-30, 2016.
- Siemens Digital Industries Software, “Assessing composite variability’s impact on performance with virtual testing,” Simcenter blog post, May 2020.
- F. Malgioglio, F. Mesquita, C. Breite, A. Matveeva, L. Farkas, W. Desmet, S.V. Lomov, Y. Swolfs, “Prediction of tensile stiffness and failure of carbon fiber composite laminae: a multi-scale non-deterministic approach,” Proceedings of ECCM18, Athens, Greece, June 24-28, 2018.
- Y. Swolfs, “Hybridisation of self-reinforced composites: modeling and verifying a novel hybrid concept,” Ph.D. thesis, KU Leuven, Department of Materials Engineering, January 2015.
- S. Pimenta, S.T. Pinho, “Hierarchical scaling law for the strength of composite fiber bundles,” Journal of the Mechanics and Physics of Solids, 61, pp. 1337-1356, 2013.
- F. Malgioglio, “Material Variability across the Scales in Unidirectional Composites – Virtual Material Characterisation under Longitudinal Tension,” Ph.D. thesis, KU Leuven, Department of Materials Engineering, November 10, 2020.

Don’t hesitate to contact Thanh for advice on automation solutions for CAD / CAM / CAE / PLM / ERP / IT systems exclusively for SMEs.
Luu Phan Thanh (Tyler) Solutions Consultant at PLM Ecosystem Mobile +84 976 099 099
Web www.plmes.io Email tyler.luu@plmes.io
