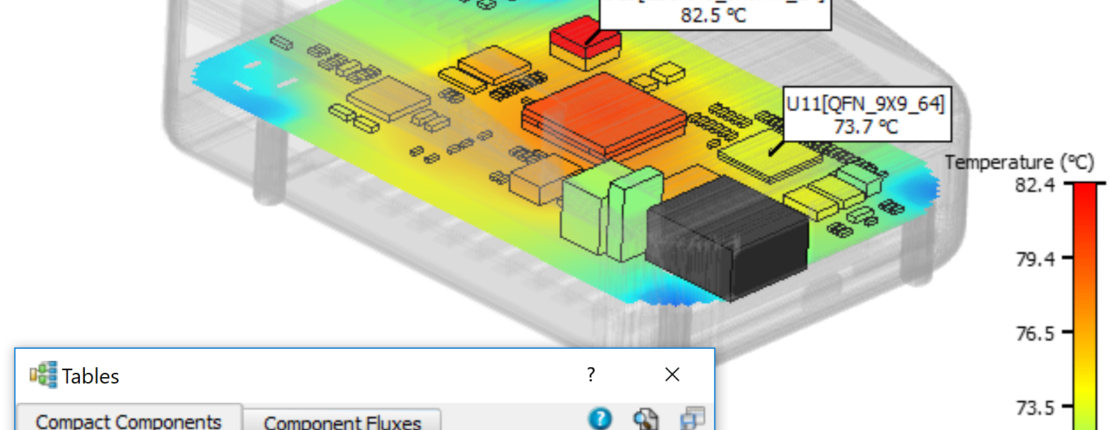
Post-processing in Simcenter Flotherm isn’t just about pretty pictures. However, it feels that way sometimes. Often engineers want hard numbers to determine whether the design is going to work out well or not.
In Simcenter Flotherm 2019.2 post-processing had a revamp for all your needs, including the creation of pretty pictures. You might have missed it the first time around, so here’s a recap of all that changed and some tips on how to use it to best advantage.
Simplicity and Speed
Simcenter Flotherm now has a results mode to access post-processing features. When you switch to results mode, you’ll see a results tree on the right side of the software window.
Graphics are shown with results and tables just below with property sheets displayed under the tree. Everything is right at your fingertips with no multiple clicks.
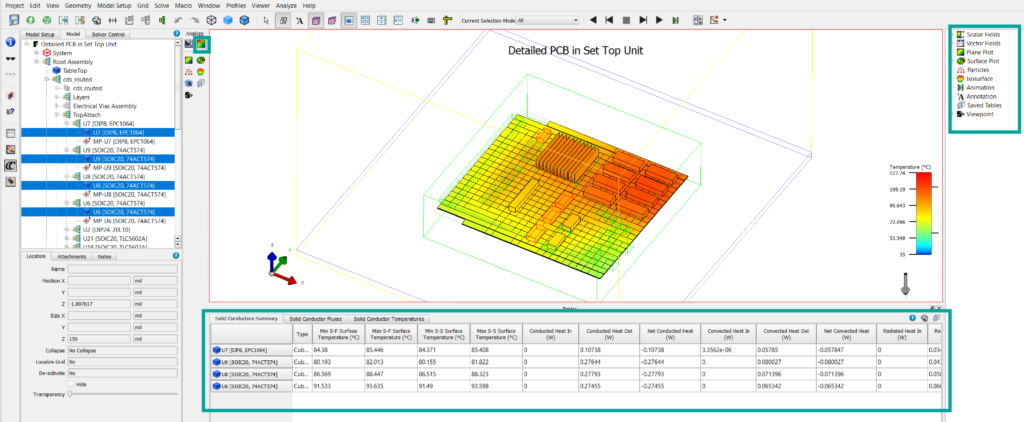
We optimised plots for performance, and they can now take advantage of multiple cores. This reduces the time to produce surface plots in particular. What could have taken an hour before now takes less than a second.
Plots associated with geometry and results
Plane plots have also been improved by allowing them to be associated with geometry. This comes into its own when using the command centre.
Now you can set up the plot on the base case, and it will follow the geometry as you move it in your different scenarios. For instance, place the plot and associate it with a fan in your model. As you move the fan location for each variation, the plane plot will move with it making results set up for a large command centre run a breeze.
You can also associate plane plots with results. For example, you can place the plot wherever the maximum temperature occurs.
Particle plots have had a similar treatment so you can associate them with geometry and have them move as your geometry moves.
Surface plot intelligence boost
Surface plots have got smarter. We now store each plot as an individual plot in the results tree so you can easily move between them. Switch them on and off as you need without having to recreate them each time.
Get the numerical data you need fast.
Tables. This is where the real engineers go for results. Now you can select objects in the model tree, and your relevant data instantly appears in the table display.
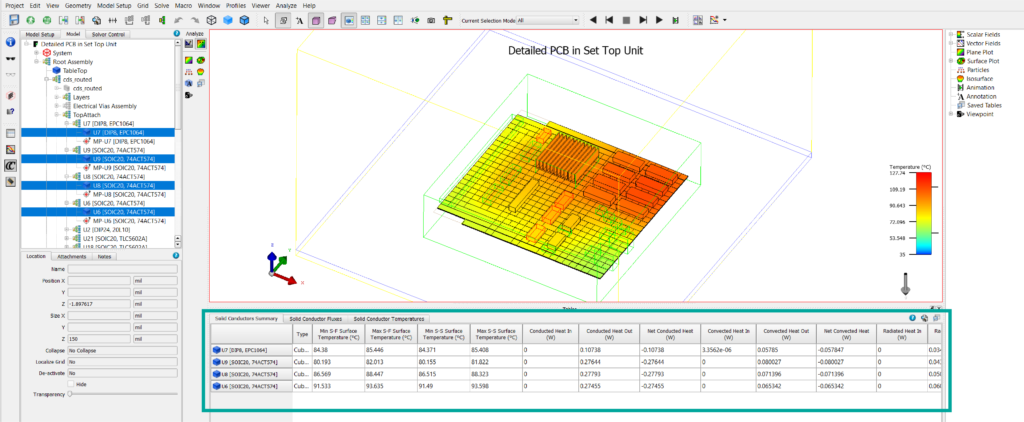
We also have tables for source objects and perforated plates. You can also interrogate whole assemblies and heat sinks – no more excel calculations for you.
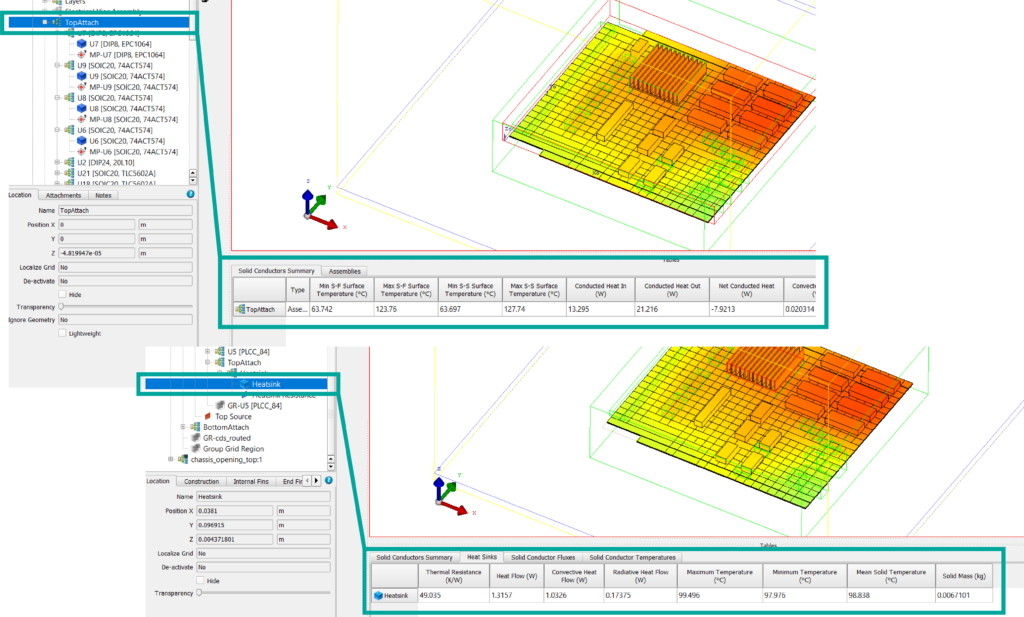
For each table you create, you can save it in the results tree for viewing later. You can display the table of results for each of your saved time’s steps, and you can export just at the one-time step or for all time steps.
Find and select functionality within tables.
We know it can be a pain to find that one component when you have hundreds, or you want to know which ones are above a certain temperature. We’ve made it possible for you to search within your table results with our powerful find and select functionality. You can search the entire project or just within selected assemblies.
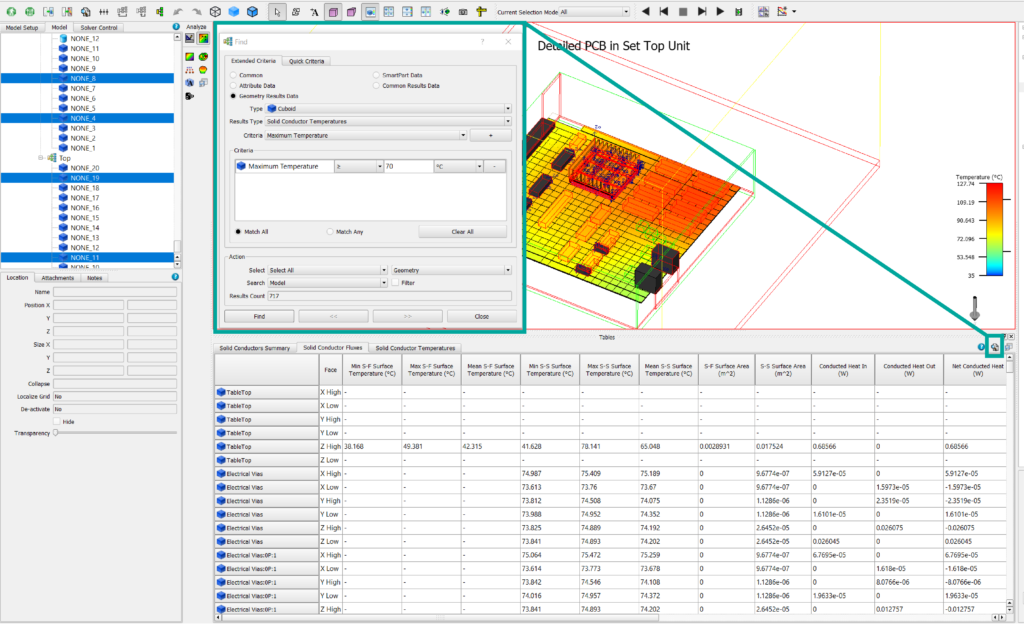
The geometry results from data search option allow you to search for particular geometry types that meet certain criteria. For instance, you could search for all cuboids that have a maximum solid temperature above 70degC.
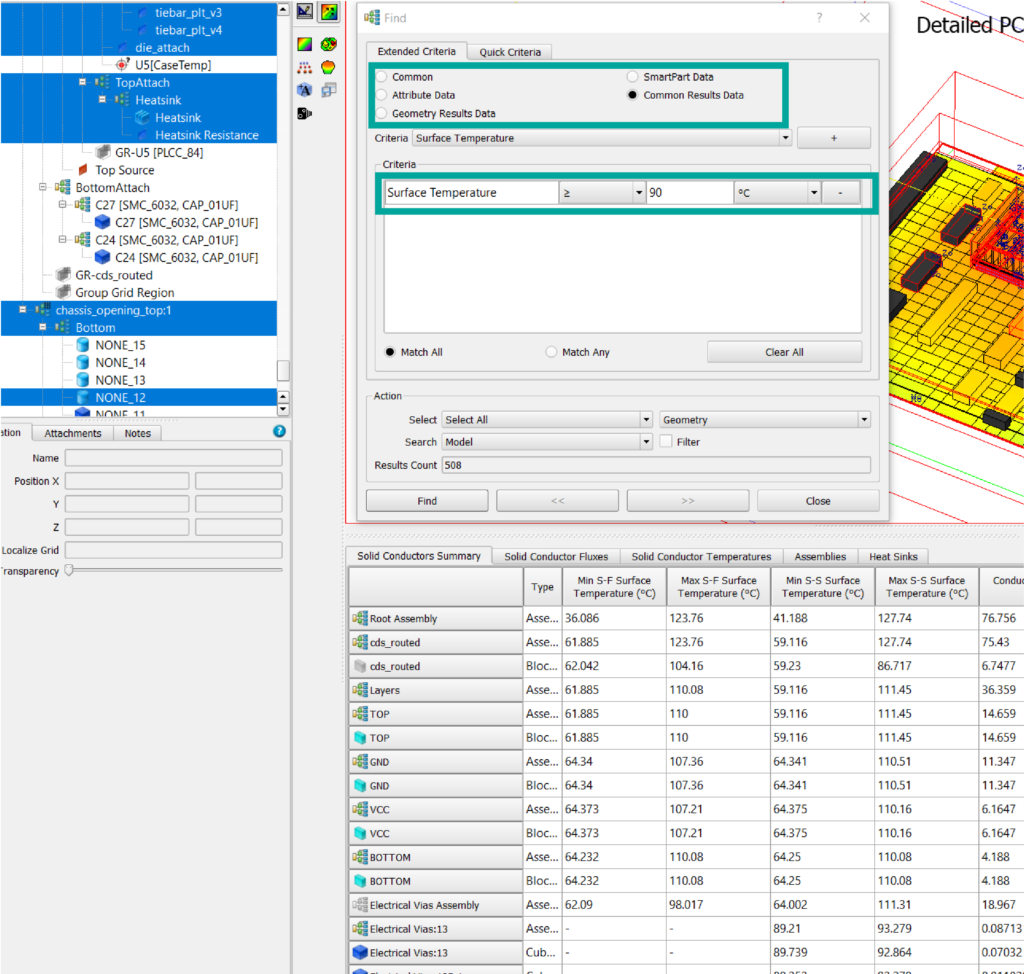
You can also search for common results. This allows you to search for results data that multiple objects types have in common—for example, any objects with a surface temperature above 70degC.
View results for each scenario within the main project
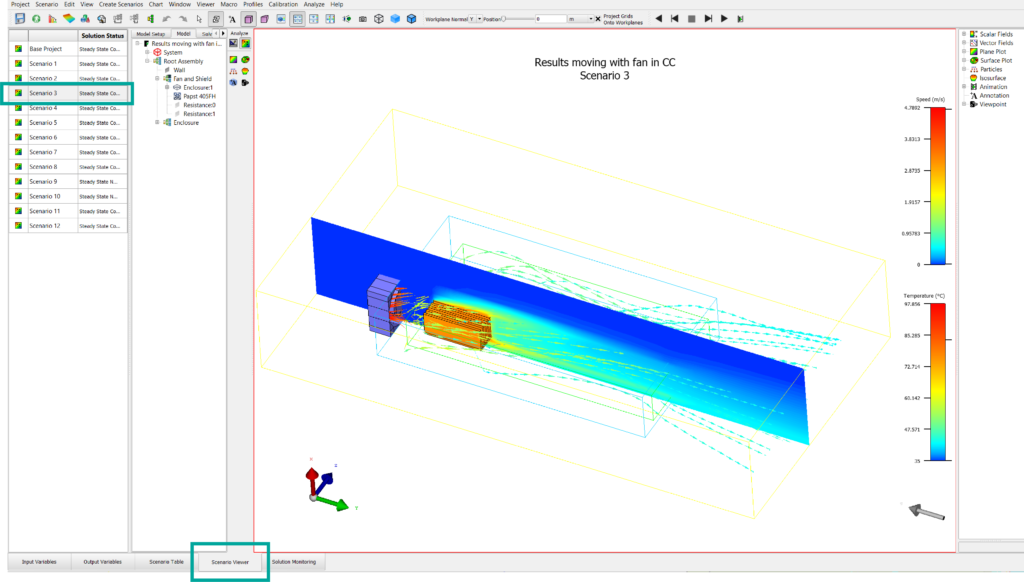
We’ve also implemented a scenario viewer tab so you can view the results for each scenario in the command centre without having to create a new project and load the results.
Scripting capabilities
All post-processing is now scriptable and can be fully automated. Do you have to produce the same plots and tables for every model? Now you can easily produce a script and save yourself a ton of time. Generate all images, animations and tables you need for a report while you make yourself a coffee, or a margarita, I won’t judge.
Share the script with colleagues, standardise your thermal design reporting, and let everyone enjoy some cocktail time. It could be the perfect emailable gift for secret Santa while we can’t be in the office together. They say something you made yourself is best, right?

Don’t hesitate to contact Thanh for advice on automation solutions for CAD / CAM / CAE / PLM / ERP / IT systems exclusively for SMEs.
Luu Phan Thanh (Tyler) Solutions Consultant at PLM Ecosystem Mobile +84 976 099 099
Web www.plmes.io Email tyler.luu@plmes.io
